
How to Revolutionise Your Small Business With Data

Big data was once the exclusive playground of multinational enterprises with massive capital reserves and dedicated engineering departments. For decades, small enterprise operators were forced to rely on instinct, subjective opinions, and informal trial and error to chart their growth. However, the continuous expansion of modern digital ecosystems has fundamentally altered commerce, allowing smaller organizations to capture and interpret immense volumes of information regarding customer behaviors, transaction patterns, and everyday operational performance.
By transforming raw transactional details and digital touchpoints into actionable insights, data functions as an objective operational compass for business owners. Rather than relying on guesswork to determine how products should be marketed or how inventory should be financed, leadership can ground routine decisions in documented performance outcomes. Embracing a structured analytics strategy allows emerging enterprises to refine customer acquisition, elevate service quality, optimize financial health, and maximize their full competitive potential.
Key takeaways
- Modern digital tools democratize big data, enabling small firms to replace subjective guesswork with real-world customer metrics.
- Strategic email marketing informed by engagement data and list segmentation can deliver an average return on investment of $44 for every dollar spent.
- Comprehensive customer profiles and usage tracking empower support teams to solve customer friction points proactively.
- Rigorous financial and demand forecasting combines historical patterns with present conditions to safeguard cash reserves and balance inventory.
- Employing standardized comparisons like Month over Month and Year over Year helps distinguish genuine commercial expansion from normal seasonal swings.
The Evolution of Business Data: From Mental Tallies to Modern Ecosystems
In traditional commerce, understanding consumer demand was an informal, fragmented process. Small merchants relied on casual face-to-face interactions, handwritten sales slips, and sporadic verbal feedback to gauge the health of their enterprises. Shopkeepers kept mental tallies of popular inventory items and attempted to remember the distinct tastes of frequent patrons. While this intimate style of merchant engagement had distinct customer service virtues, it was fundamentally impossible to scale, vulnerable to memory lapses, and prone to costly human error.
As standard commerce transitioned toward digital platforms and business management software, operational records shifted out of physical filing cabinets and into centralized digital storage. Early implementations of computerized tracking were notoriously complex, demanding specialized technical personnel and expensive infrastructure that shut out small businesses. Over time, cloud infrastructure and interconnected software suites dismantled these financial barriers. Today, entry-level platforms automatically capture customer discovery paths, communications, and purchase actions, granting small firms the same analytical depth once restricted to global conglomerates.
Data functions as an objective operational compass, grounding daily decisions in observable customer behaviors rather than subjective guesswork.
Core Operational Areas Transformed by Business Data
To extract meaningful value from daily interactions, business operators must recognize how raw activity translates into operational clarity. Systematically tracking the customer experience across various touchpoints provides actionable intelligence across several core business functions.
During the initial stages of the sales process, prospective buyers research competing options, consume promotional material, and navigate online properties. Tracking these early engagements helps you improve your understanding of what customers look for before buying. Observational data might reveal that your audience engages far more heavily with short educational videos than with long technical articles. Furthermore, monitoring the exact search keywords that bring users to your landing pages clarifies customer intent, allowing you to tailor your messaging precisely to their expectations.
Direct communication channels also yield immediate performance improvements when steered by measurement. Email remains an essential asset for customer engagement, boasting an average ROI of $44 for every dollar spent. Achieving this substantial return requires deliberate planning rather than distributing generic, one-size-fits-all email blasts. By studying email open rates, click-through patterns, and individual link interactions, companies can segment audiences into distinct interest groups and deliver targeted communications that directly address specific buyer interests.

Operational data also revolutionizes post-purchase relationship management. Maintaining structured customer profiles and monitoring how clients utilize your product or service over time provides an objective view of the user experience. Logging common inquiries and recurring complaints enables customer service teams to anticipate friction before it escalates, giving staff the exact context needed to solve issues immediately and retain customer loyalty.
Equally critical is the ability to recognize missteps before they inflict severe financial harm. Business operations inherently involve occasional errors, such as deploying an unappealing advertisement, choosing confusing website navigation, or launching an unpopular product bundle. Systematic measurement acts as an early warning system. If customer interactions plummet after a website redesign or visitors refuse to engage with a new call-to-action (CTA) button, performance data highlights the drop-off immediately so leadership can reverse course.
Finally, data serves as the foundation for operational forecasting. By combining documented historical performance with current market indicators, forecasting produces reliable projections of future business conditions. Evaluating these metrics helps organizations anticipate seasonal demand fluctuations, identify which product categories rise or fall during specific periods, and adjust inventory orders accordingly. On the financial side, predictive analysis helps managers anticipate cash flow variations, balance account reserves, and fund future business expansion safely.
Essential Platforms to Capture and Analyze Business Data
Modern analytical software provides small firms with specialized instruments for tracking website traffic, managing pipelines, and building technical literacy. The following tools represent accessible, industry-standard options for gathering and interpreting operational data.
Google Analytics

Google Analytics serves as a foundational web measurement platform that monitors online visitor behavior free of charge. The platform details how prospects discover your brand, tracking the specific search keywords, referral links, and marketing campaigns that generate incoming traffic. Business operators use its reporting features to identify which digital pages command user attention, assess engagement across different content formats, and monitor conversion paths throughout the buyer journey. Google also provides free training courses to assist business owners in configuring custom dashboards and reading measurement charts effectively.
HubSpot

HubSpot functions as an integrated software suite that consolidates customer interactions, sales pipelines, and outreach initiatives into a centralized hub. The platform records engagement histories across contact databases, allowing organizations to evaluate lead progression and marketing efficacy simultaneously. Small firms frequently leverage its analytics features to forecast commercial revenue, track outreach campaigns, and organize customer data into targeted cohorts for segmented email delivery.

EngageBay

EngageBay is an integrated business tool that aligns marketing automation, customer relationship management, and service workflows. It captures touchpoints across the customer lifecycle, allowing expanding businesses to track user profiles, log inbound inquiries, and identify recurring support tickets. By uniting pipeline metrics and communications data in a single system, the platform aids small enterprises in assessing sales velocities and generating dependable revenue forecasts.
Pipedrive
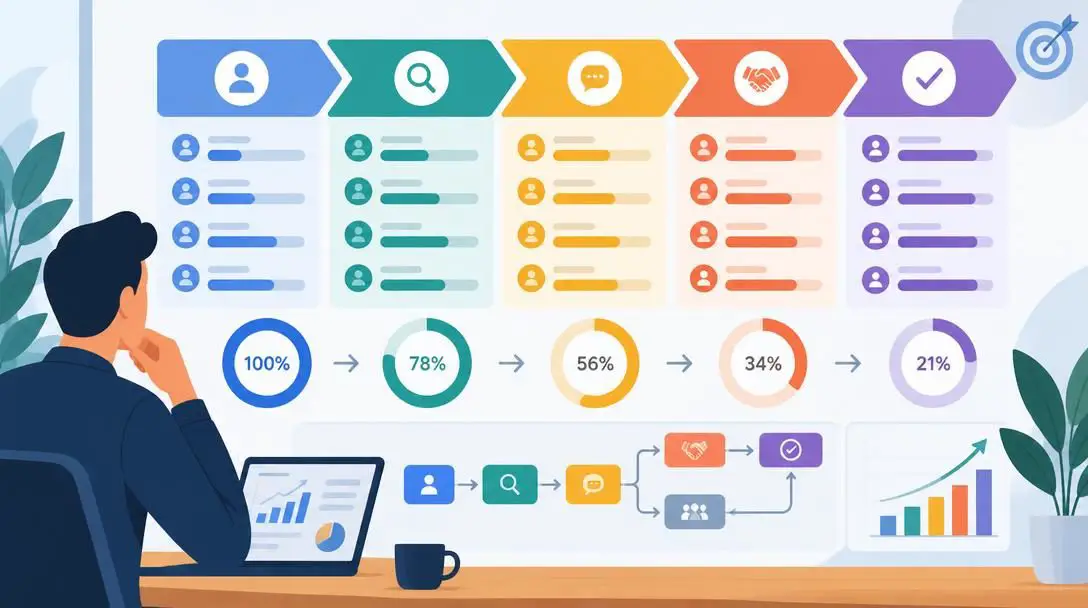
Pipedrive provides an activity-oriented sales management environment designed to monitor customer interactions throughout complex buying journeys. The software tracks outreach tasks, conversion rates at individual deal stages, and overarching pipeline health. Small teams utilize its sales analytics and reporting tools to evaluate historical close rates, predict forthcoming sales volume, and pinpoint operational bottlenecks that hinder buyer progression.
Coursera

Coursera operates as a prominent massive open online course (MOOC) platform that equips small business owners with formal analytical knowledge. The educational service hosts structured training modules that cover data analytics, spreadsheet modeling, and business management fundamentals. Utilizing courses on Coursera enables entrepreneurs to understand how to configure metrics, read business charts accurately, and apply advanced comparative frameworks like Month over Month and Year over Year evaluations without needing an internal engineering team.
| Tool | Platform Category | Primary Operational Focus |
|---|---|---|
| Google Analytics | Web Analytics Software | Visitor traffic, discovery keywords, and page engagement tracking |
| HubSpot | Integrated CRM & Pipeline Platform | Customer interactions, sales pipeline health, and revenue forecasting |
| EngageBay | All-in-One Operations Platform | Lead tracking, customer service management, and campaign analytics |
| Pipedrive | Sales Pipeline Management | Sales stage tracking, deal velocities, and close-rate forecasting |
| Coursera | Online Education (MOOC) Platform | Analytics training, data evaluation techniques, and business modeling |
A Methodical Guide to Implementing Business Analytics
Shifting an enterprise from speculative decision-making to a disciplined, data-driven framework does not require massive capital investment. Following a structured series of deployment stages ensures an organization establishes a functional analytics pipeline with minimal operational friction.
- Establish a foundation with accessible tracking tools: Integrate a no-cost platform such as Google Analytics onto your website to record incoming traffic sources, user acquisition keywords, and on-page viewing habits.
- Adopt an integrated customer and pipeline tracker: Deploy a centralized customer relationship management platform such as HubSpot, EngageBay, or Pipedrive to capture sales conversations, monitor pipeline bottlenecks, and aggregate contact records.
- Complete structured educational training: Master analytical dashboards by completing free educational courses provided directly by Google, or expand commercial analytics skills through data-focused business courses on Coursera.
- Incorporate standardized comparative frameworks: Study Month over Month (MoM) and Year over Year (YoY) performance calculations to balance out seasonal anomalies, isolate true commercial growth, and interpret revenue fluctuations realistically.
- Segment your audience for targeted outreach: Evaluate customer interaction logs, past transaction volumes, and communication click data to separate contact rosters into targeted groups, ensuring tailored marketing campaigns.
- Audit touchpoints and correct failing elements: Continuously monitor user responses to newly launched advertisements, layout changes, and call-to-action (CTA) buttons, using immediate engagement drops as alerts to modify creative approaches.
Common Analytics Mistakes to Avoid
Adopting big data techniques provides a clear operational advantage, yet many business operators undermine their own efforts through poor analytical practices. Avoiding these common procedural errors preserves time and protects capital resources.
- Collecting data without defined operational intent: Gathering enormous amounts of visitor and sales information without a clear business objective creates clutter. Every tracked metric must connect directly to an explicit target, such as improving customer service response times, boosting email click rates, or shortening the sales cycle.
- Ignoring performance warning signals: Clinging to an unappealing promotional campaign or a confusing website redesign despite clear measurement indicating customer disinterest leads to sustained losses. Leadership must treat negative metrics as definitive proof to correct course.
- Analyzing single metrics in complete isolation: Evaluating an isolated indicator without considering the entire sales funnel distorts strategic decisions. For example, celebrating an exceptional email open rate provides little comfort if none of those readers click through to purchase your goods.
- Broadcasting unsegmented communications: Sending generic, one-size-fits-all email blasts to an entire database destroys customer engagement and squanders the potential $44 ROI per dollar spent that targeted email marketing can deliver.
- Failing to learn the underlying software: Reviewing advanced dashboards without taking advantage of free training resources, such as Google's official educational programs or MOOC courses on Coursera, regularly results in misinterpreting charts and acting on flawed conclusions.
Frequently asked questions
Do small businesses need complex technical teams to implement big data?
No. Cloud platforms, accessible tools like Google Analytics, and centralized software like HubSpot, EngageBay, or Pipedrive allow small business owners to track visitor journeys, manage customer interactions, and build sales forecasts without writing code or hiring technical personnel.
How does data help increase the return on email marketing?
Email marketing can return an average of $44 for every dollar spent when backed by analytics. Tracking open rates and click patterns allows businesses to segment contact lists based on specific customer interests rather than distributing generic, one-size-fits-all communications.
Why are Year over Year and Month over Month comparisons necessary?
Evaluating metrics through Year over Year (YoY) and Month over Month (MoM) frameworks allows companies to account for regular seasonal swings. These comparisons ensure that seasonal sales spikes or dips are not mistaken for permanent shifts in commercial health.
Where can small business owners learn analytics skills for free or low cost?
Google offers free training courses that explain how to configure and read Google Analytics charts. Additionally, massive open online course (MOOC) platforms like Coursera provide structured coursework covering data analysis and business modeling fundamentals.
How can business analytics prevent costly commercial mistakes?
Data provides immediate feedback on customer reactions. If a website redesign leads to fewer clicks on calls to action (CTAs) or an advertising campaign receives poor engagement, metrics alert management to fix the issue before long-term revenue suffers.
The bottom line
Transforming a small firm into a data-driven enterprise is an ongoing operational commitment rather than a one-time technical installation. By replacing intuition and casual guesswork with verifiable consumer interactions, organizations can identify customer discovery paths, refine outreach campaigns, eliminate support bottlenecks, and make reliable financial projections. Utilizing modern business tools like Google Analytics, HubSpot, EngageBay, and Pipedrive empowers emerging brands to forecast growth, navigate seasonal demand, and allocate cash reserves with confidence. When business owners treat routine performance metrics as strategic assets, small operations remain nimble, resilient, and prepared to outpace their competition.