Best Individual Batting Seasons of the 2010s According to FanGraphs
During the 2010s, baseball experienced a seismic shift toward advanced analytics. Spurred by widespread internet access and mathematicians identifying the exact traits that drive victories, the sport shifted away from relying exclusively on century-old box-score metrics. Independent analytical outlets like FanGraphs spearheaded this evolution by establishing comprehensive frameworks that measure total on-field contribution.
Chief among these metrics is wins above replacement (WAR). By synthesizing hitting, baserunning, and defensive prowess into a single unified benchmark, the FanGraphs WAR framework revealed which individual campaigns from the decade reached unprecedented heights. The resulting rankings highlight not only unmatched individual peaks but also a prolonged standard of excellence that redefined modern baseball greatness.
Key takeaways
- Mookie Betts captured the decade's top individual performance in 2018 with a jaw-dropping 10.6 WAR campaign for the Boston Red Sox.
- Mike Trout dominated the era like no one else, capturing four of the decade's top ten seasons and seven of the top fifteen.
- Defensive demands heavily shape overall value, allowing Buster Posey’s 2012 catcher season to claim third place overall.
- Historic traditional milestones do not guarantee top analytical rank, as Miguel Cabrera’s 2012 Triple Crown campaign missed the top thirty entirely before his superior 2013 season reached eleventh.
Deconstructing the Formula: How FanGraphs Measures Value
To understand why certain campaigns rise to the top of the analytical leaderboard, it is vital to explore how the FanGraphs wins above replacement model quantifies player contributions. Traditional statistics often isolate events without context, whereas WAR evaluates how every action on the field impacts a team's chances of winning games relative to an accessible baseline.
The system evaluates players through several core analytical pillars:
- The Concept of Replacement Level: Every player is measured against a theoretical baseline representing a readily available minor league call-up or minimum-salary free agent acquired at no cost.
- Offensive Run Values: Rather than assigning arbitrary values to singles, doubles, triples, home runs, and walks, FanGraphs measures every plate appearance outcome by its precise statistical contribution to run expectation in an inning.
- Baserunning Contribution: The model looks beyond traditional stolen bases to evaluate non-steal base advancing, taking extra bases on hits, and avoiding costly outs on the basepaths.
- Defensive Impact: Players receive credit or deductions based on defensive runs saved or lost relative to average peers at their position.
- Positional Weighting: High-leverage, physically taxing positions such as catcher, shortstop, and center field receive structural value boosts, acknowledging that elite offense from premium defensive positions is exceptionally rare.
- Park and League Adjustments: Run totals are normalized for league run environments and home ballpark characteristics, ensuring hitters in friendly or punishing parks are graded equitably.
The Decade’s Benchmark: At a Glance Comparison
Across the entire decade, only a handful of hitters generated enough multi-faceted production to reach the upper stratosphere of modern player evaluation. The table below outlines the premier individual batting campaigns of the 2010s.
| Player | Season | Team | Key Traditional Stats | Decade Standing |
|---|---|---|---|---|
| Mookie Betts | 2018 | Boston Red Sox | .346 BA, 32 HR, 80 RBI, 129 R, 30 SB | Number 1 overall (10.6 WAR) |
| Mike Trout | 2013 | Los Angeles Angels | .323 BA, 27 HR, 97 RBI, .432 OBP, 33 SB | Number 2 overall |
| Buster Posey | 2012 | San Francisco Giants | .336 BA, 24 HR, 103 RBI | Number 3 overall |
| Bryce Harper | 2015 | Washington Nationals | .330 BA, 42 HR | Number 7 overall |
| Mike Trout | 2015 | Los Angeles Angels | MVP-level standard across all facets | Number 8 overall |
| Aaron Judge | 2017 | New York Yankees | 52 HR | Number 9 overall |
| Josh Donaldson | 2015 | Toronto Blue Jays | .297 BA, 41 HR | Number 10 overall |
| Miguel Cabrera | 2013 | Detroit Tigers | Elite contact, discipline, and power | Number 11 overall |
The Top Three Individual Campaigns of the 2010s
The very pinnacle of the decade's leaderboard featured seasons that combined elite offensive production, disciplined plate approach, and outstanding defensive run prevention.
Mookie Betts (2018, Boston Red Sox)

- WAR Total: 10.6 wins above replacement
- Award: American League MVP
- Decade Rank: 1st overall
The single greatest batting campaign of the 2010s belonged to Mookie Betts during his 2018 World Series championship run with the Boston Red Sox. Betts was awarded the American League MVP in a landslide, and the analytics supported the decision by awarding him an astonishing 10.6 wins above replacement.
Betts won the American League batting title with a .346 batting average while launching 32 home runs. Because he batted primarily at the top of the Boston lineup, he collected a modest 80 runs batted in, but he crossed the plate an extraordinary 129 times. He added 30 stolen bases, controlled the strike zone with a walk rate that nearly exceeded his strikeout rate, and played gold-standard defense in right field, assembling the modern era's premier template for well-rounded baseball production.
Mike Trout (2013, Los Angeles Angels)

- Decade Rank: 2nd overall
- Key Slash Line: .323 BA, .432 OBP
- Speed and Power: 27 home runs, 33 stolen bases
The absolute peak of Mike Trout's individual greatness arrived in 2013, finishing as the second-best overall batting season of the decade according to FanGraphs. Trout displayed complete mastery at the plate, pairing a .323 batting average with 27 home runs and 97 runs batted in while recording an extraordinary .432 on-base percentage.

Trout's offensive discipline was complemented by terrorizing opposing pitchers on the basepaths with 33 stolen bases. Paired with stellar outfield defense, Trout established a dynamic, all-around standard that solidified his standing as the premier player of the decade.
Trout dominated the modern analytical era so thoroughly that he accounted for seven of the top fifteen individual seasons of the entire decade.
Buster Posey (2012, San Francisco Giants)

- Decade Rank: 3rd overall
- Award: National League MVP
- Traditional Marks: .336 BA, 24 HR, 103 RBI
Holding the third overall spot for the 2010s was San Francisco Giants backstop Buster Posey. Coming off a major injury the prior year, Posey produced a batting clinic in 2012, hitting .336 with 24 home runs and 103 runs batted in to capture the National League MVP award.
While Posey's standard batting numbers were elite on their own, the FanGraphs model elevated his campaign due to positional scarcity. Handling the game's most physically demanding position while framing pitches, guiding a championship pitching staff, and leading the league in batting average generated one of the highest single-season WAR totals ever recorded by a catcher.
Dominating the Upper Tier: High Peaks Across the Decade
Because Mike Trout secured four separate spots in the decade's top ten, very little room remained for the rest of Major League Baseball. Outside of Trout, not a single hitter placed more than one season inside the top ten, turning the rest of the leaderboard into a collection of stunning peak campaigns.
Bryce Harper (2015, Washington Nationals)

- Decade Rank: 7th overall
- Award: National League MVP
- Key Production: .330 BA, 42 HR
In 2015, Bryce Harper put together one of the most devastating offensive breakouts in modern baseball history. Harper posted a .330 batting average and mashed 42 home runs for the Washington Nationals, demonstrating a rare blend of explosive raw power, high-contact hitting, and elite on-base skills that secured him a unanimous National League MVP trophy and seventh place on the decade leaderboard.
Mike Trout (2015, Los Angeles Angels)
- Decade Rank: 8th overall
- Context: Finished directly behind Harper's breakout
Right behind Harper's historic performance sat Mike Trout's 2015 campaign at number eight. This campaign exemplified Trout's sustained, metronomic brilliance, providing MVP-caliber offensive production, walk-rate mastery, and outfield defense that mirrored his other top-tier seasons.
Aaron Judge (2017, New York Yankees)

- Decade Rank: 9th overall
- Power Metric: 52 home runs
Landing in the ninth position was Aaron Judge's memorable 2017 rookie-status breakout with the New York Yankees. The towering slugger blasted 52 home runs, combining jaw-dropping exit velocity and raw power with an elite walk rate to produce one of the most explosive individual displays of the twenty-first century.
Josh Donaldson (2015, Toronto Blue Jays)
- Decade Rank: 10th overall
- Award: American League MVP
- Key Production: .297 BA, 41 HR
Rounding out the tenth spot on the leaderboard was Josh Donaldson's electric 2015 run with the Toronto Blue Jays. Donaldson anchored Toronto's explosive lineup by hitting .297 with 41 home runs while offering stellar third-base defense, capturing the American League MVP award along the way.
Jacoby Ellsbury (2011, Boston Red Sox)
- Decade Position: Bottom half of the top ten
- Award Finish: 2nd in AL MVP voting
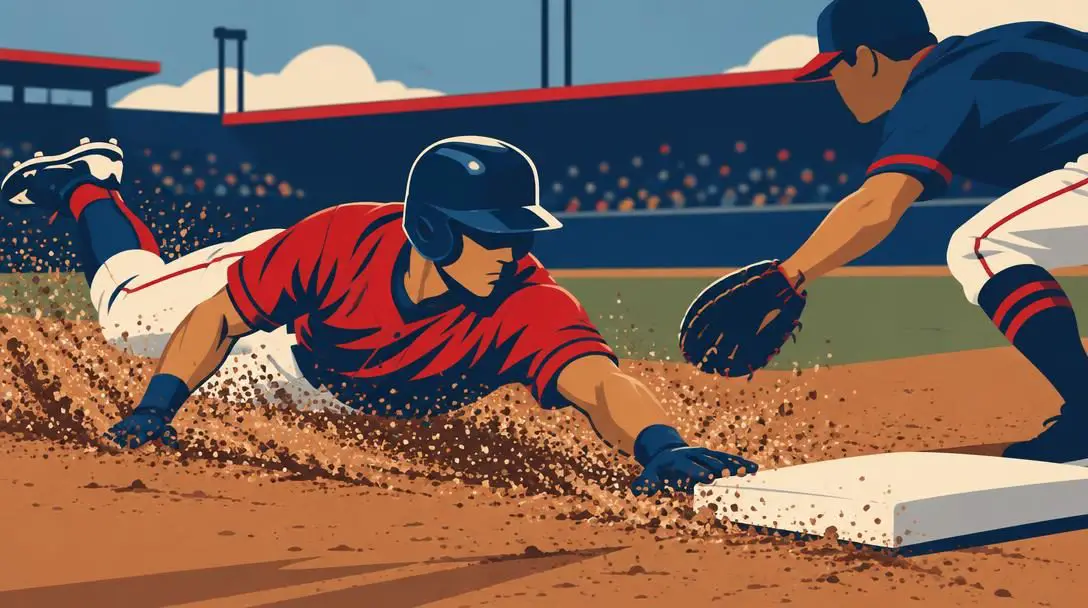
Occupying a spot in the lower half of the top ten was Jacoby Ellsbury's multi-faceted 2011 campaign. Ellsbury paired his trademark premium baserunning and elite center-field defense with an unexpected power surge, finishing as the American League MVP runner-up behind ace pitcher Justin Verlander.
The Triple Crown Paradox: Contextualizing Miguel Cabrera
One of the most compelling discussions surrounding modern baseball analytics involves Detroit Tigers slugger Miguel Cabrera. In 2012, Cabrera achieved a historic milestone by capturing the American League Triple Crown—leading the league in batting average, home runs, and runs batted in—a feat not accomplished since 1967.
Despite that historic achievement, Cabrera's 2012 season failed to crack the top thirty individual seasons of the 2010s in FanGraphs WAR. The analytical framework factored in his below-average baserunning and defensive limitations at third base, showing that while his bat was legendary, his overall win contribution was dampened by non-hitting phases of the game.
Miguel Cabrera (2013, Detroit Tigers)

- Decade Rank: 11th overall
- Context: Outranked his own Triple Crown campaign
Ironically, it was Miguel Cabrera's 2013 campaign that achieved genuine analytical immortality. Cabrera nearly matched his Triple Crown numbers while generating even better overall hitting metrics across the board. That 2013 follow-up surged into the upper tier of the decade's leaderboard, finishing as the eleventh-best overall individual performance of the 2010s.
A Step-by-Step Guide to Evaluating Historical Seasons
Assessing individual seasons through modern analytical frameworks requires looking past surface-level statistics. Fans and analysts can evaluate historical campaigns systematically using this structured approach:
- Check the Complete WAR Profile: Examine the player's total WAR on FanGraphs, then break down the specific components to see whether value was generated primarily via the batter's box, baserunning, or defensive run prevention.
- Evaluate Positional Adjustments: Identify which defensive position the player occupied. Premium roles such as catcher, shortstop, or center field provide structural value boosts relative to first basemen or designated hitters.
- Assess Plate Discipline Metrics: Study walk and strikeout rates. Hitters who maintain strikeout totals close to their walk counts while hitting for power establish resilient, high-value run creation profiles.
- Look Past Context-Dependent Counting Stats: Treat metrics like runs batted in (RBI) and runs scored as reflections of lineup context. RBI tallies depend heavily on how often teammates reach base ahead of a hitter.
- Factor in Defensive Run Values: Check the player's defensive runs saved and positional metrics to see if their glove enhanced or detracted from their offensive contributions.
Pitfalls to Avoid When Comparing Player Value
When analyzing individual campaigns from the 2010s or comparing modern seasons against past eras, observers frequently run into common analytical errors:
- Assuming Traditional Awards Guarantee Top Value: As demonstrated by Miguel Cabrera in 2012, winning a prestigious traditional award does not automatically mean a player produced the highest comprehensive win total in baseball.
- Equating Team Playoff Success with Player Excellence: Baseball is an inherently team-dependent sport. Mike Trout assembled one of the most dominant individual decades in sports history despite the Angels reaching the postseason only once, where they were swept in the ALDS by the Kansas City Royals.
- Overvaluing Raw RBI Totals: In 2018, Mookie Betts drove in only 80 runs due to batting leadoff, but he scored 129 runs and generated tremendous run value that old-school counting stats obscure.
- Ignoring the Impact of Games Missed: WAR is a cumulative counting stat. When Mike Trout surpassed his 2014 total of 8.3 WAR during the 2019 season despite missing twenty-three more games, it revealed that his per-game production rate had reached historic efficiency.
Frequently asked questions
Why is Mookie Betts's 2018 season ranked above Mike Trout's best years?
Betts put together a complete season with an astonishing 10.6 FanGraphs WAR. He won the batting title at .346, hit 32 home runs, stole 30 bases, scored 129 runs, walked nearly as often as he struck out, and provided Gold Glove-caliber outfield defense.
Why did Miguel Cabrera's 2012 Triple Crown season rank lower than his 2013 season?
FanGraphs WAR evaluates defense and baserunning alongside hitting. Cabrera's defensive and basepath metrics subtracted value in 2012. In 2013, his underlying offensive numbers improved so dramatically that they pushed his total value to eleventh overall for the decade.
How many times did Mike Trout place in the decade's top ten seasons?
Mike Trout captured four of the top ten individual seasons of the 2010s, highlighted by his 2013 campaign at number two and his 2015 season at number eight. He also accounted for seven of the top fifteen seasons across the entire decade.
Why did Buster Posey rank in the top three over pure sluggers?
Posey played catcher, the most physically demanding defensive position on the field. Pairing a league-leading .336 batting average with elite defense behind the plate granted him a massive positional adjustment boost in the WAR calculation.
Did Mike Trout's lack of postseason success hurt his FanGraphs WAR?
No. FanGraphs WAR evaluates regular-season individual performance independent of team outcomes. Even though the Angels only reached the postseason once in the 2010s and were swept by the Royals, Trout's individual regular-season production remained historically elite.
The bottom line
The 2010s cemented wins above replacement as an indispensable lens for understanding baseball excellence. By weighing offensive run value, plate discipline, baserunning efficiency, and positional defense, the FanGraphs framework separated multi-dimensional contributors from one-dimensional specialists. Whether examining Mookie Betts's balanced 2018 masterclass, Buster Posey's defensive and hitting supremacy behind the plate, or Mike Trout's historic decade-long dominance, modern analytics allow us to appreciate the true breadth of modern baseball talent.